| Title: | Competing Risks Estimation |
| Version: | 1.1.0 |
| Description: | Provides an intuitive interface for working with the competing risk endpoints. The package wraps the 'cmprsk' package, and exports functions for univariate cumulative incidence estimates and competing risk regression. Methods follow those introduced in Fine and Gray (1999) <doi:10.1002/sim.7501>. |
| License: | AGPL (≥ 3) |
| URL: | https://mskcc-epi-bio.github.io/tidycmprsk/, https://github.com/MSKCC-Epi-Bio/tidycmprsk |
| BugReports: | https://github.com/MSKCC-Epi-Bio/tidycmprsk/issues |
| Depends: | R (≥ 4.2) |
| Imports: | broom (≥ 1.0.1), cli (≥ 3.1.0), cmprsk (≥ 2.2.10), dplyr (≥ 1.0.7), ggplot2 (≥ 3.3.5), gtsummary (≥ 2.0.0), hardhat (≥ 1.3.0), purrr (≥ 0.3.4), rlang (≥ 1.0.0), stringr (≥ 1.4.0), survival, tibble (≥ 3.1.6), tidyr (≥ 1.1.4) |
| Suggests: | aod, broom.helpers (≥ 1.15.0), cardx (≥ 0.2.0), covr (≥ 3.5.1), ggsurvfit, knitr (≥ 1.36), spelling, testthat (≥ 3.2.0) |
| Config/testthat/edition: | 3 |
| Encoding: | UTF-8 |
| Language: | en-US |
| LazyData: | true |
| RoxygenNote: | 7.3.2 |
| NeedsCompilation: | no |
| Packaged: | 2024-08-16 16:36:57 UTC; sjobergd |
| Author: | Daniel D. Sjoberg  [aut, cre, cph],
Teng Fei [aut]
[aut, cre, cph],
Teng Fei [aut] |
| Maintainer: | Daniel D. Sjoberg <danield.sjoberg@gmail.com> |
| Repository: | CRAN |
| Date/Publication: | 2024-08-17 04:10:02 UTC |
tidycmprsk: Competing Risks Estimation
Description
![]()
Provides an intuitive interface for working with the competing risk endpoints. The package wraps the 'cmprsk' package, and exports functions for univariate cumulative incidence estimates and competing risk regression. Methods follow those introduced in Fine and Gray (1999) doi:10.1002/sim.7501.
Author(s)
Maintainer: Daniel D. Sjoberg danield.sjoberg@gmail.com (ORCID) [copyright holder]
Authors:
Teng Fei (ORCID)
See Also
Useful links:
Report bugs at https://github.com/MSKCC-Epi-Bio/tidycmprsk/issues
Additional Functions for tbl_cuminc()
Description
-
add_p()Add column with p-value comparing incidence across stratum -
add_n()Add column with the total N, or N within stratum -
add_nevent()Add column with the total number of events, or number of events within stratum -
inline_text()Report statistics from atbl_cuminc()table inline
Usage
## S3 method for class 'tbl_cuminc'
add_p(x, pvalue_fun = gtsummary::style_pvalue, ...)

## S3 method for class 'tbl_cuminc'
add_n(x, location = NULL, ...)

## S3 method for class 'tbl_cuminc'
add_nevent(x, location = NULL, ...)

## S3 method for class 'tbl_cuminc'
inline_text(x, time = NULL, column = NULL, outcome = NULL, level = NULL, ...)
Arguments
x |
object of class 'tbl_cuminc' |
pvalue_fun |
function to style/format p-values. Default is
|
... |
These dots are for future extensions and must be empty. |
location |
location to place Ns. When |
time |
time of statistic to report |
column |
column name of the statistic to report |
outcome |
string indicating the outcome to select from. If |
level |
if estimates are stratified, level of the stratum to report |
Example Output
Example 1

Example 2
p-values
The p-values reported in cuminc(), glance.tidycuminc() and add_p.tbl_cuminc()
are Gray's test as described in
Gray RJ (1988) A class of K-sample tests for comparing the cumulative incidence of a competing risk, Annals of Statistics, 16:1141-1154.
See Also
Other tbl_cuminc tools:
tbl_cuminc()
Examples
# Example 1 ----------------------------------
add_cuminc_ex1 <-
cuminc(Surv(ttdeath, death_cr) ~ 1, trial) %>%
tbl_cuminc(times = c(12, 24), label_header = "**Month {time}**") %>%
add_nevent() %>%
add_n()
# Example 2 ----------------------------------
add_cuminc_ex2 <-
cuminc(Surv(ttdeath, death_cr) ~ trt, trial) %>%
tbl_cuminc(times = c(12, 24),
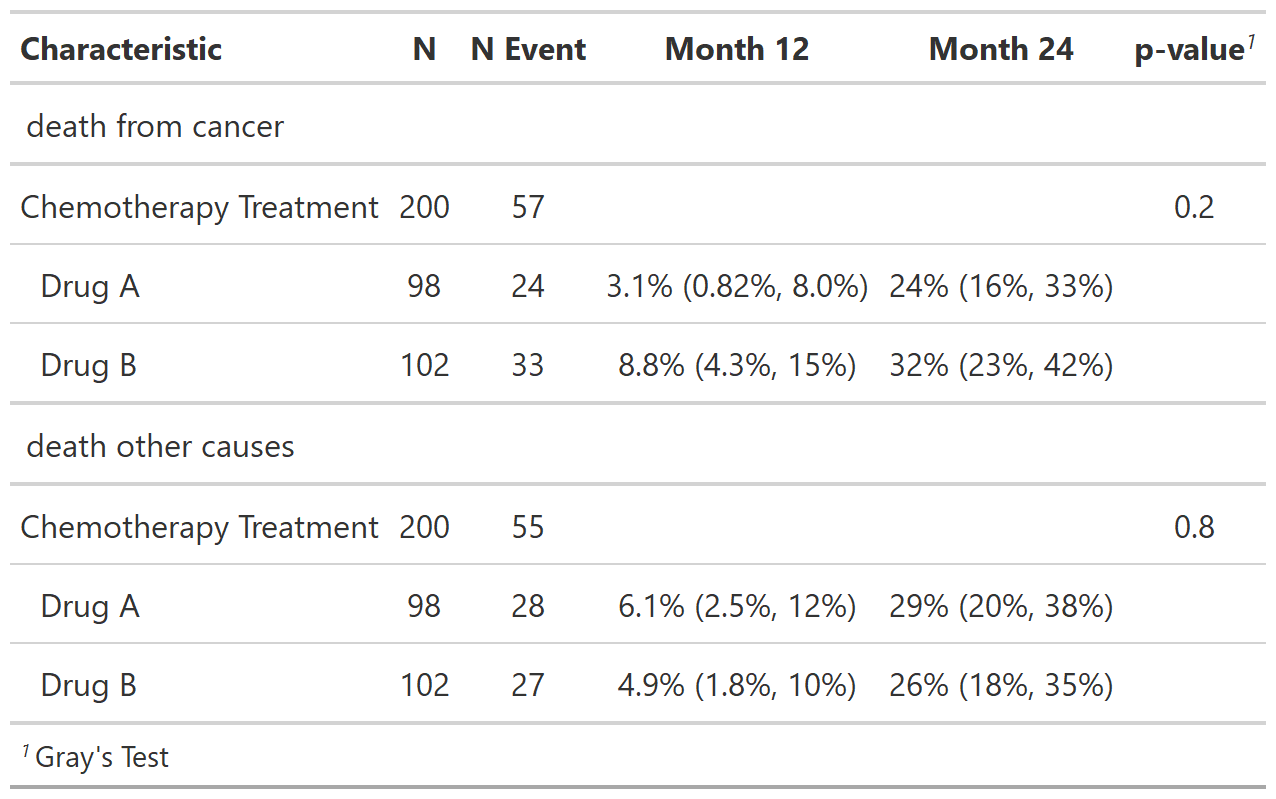
outcomes = c("death from cancer", "death other causes"),
label_header = "**Month {time}**") %>%
add_p() %>%
add_nevent(location = c("label", "level")) %>%
add_n(location = c("label", "level"))
# inline_text() ------------------------------
inline_text(add_cuminc_ex2, time = 12, level = "Drug A")
inline_text(add_cuminc_ex2, column = p.value)
Functions for tidycrr objects
Description
Functions for tidycrr objects
Usage
## S3 method for class 'tidycrr'
coef(object, ...)

## S3 method for class 'tidycrr'
vcov(object, ...)

## S3 method for class 'tidycrr'
model.matrix(object, ...)

## S3 method for class 'tidycrr'
model.frame(formula, ...)

## S3 method for class 'tidycrr'
terms(x, ...)
Arguments
... |
not used |
formula |
a formula |
x, object |
a tidycrr object |
Value
coef vector, model matrix, model frame, terms object
Examples
mod <- crr(Surv(ttdeath, death_cr) ~ age + grade, trial)

coef(mod)

model.matrix(mod) %>% head()

model.frame(mod) %>% head()

terms(mod)
Functions for tidycuminc objects
Description
Functions for tidycuminc objects
Usage
## S3 method for class 'tidycuminc'
model.frame(formula, ...)

## S3 method for class 'tidycuminc'
model.matrix(object, ...)
Arguments
formula |
a formula |
... |
not used |
object |
a tidycuminc object |
Value
a model frame, or model matrix
Examples
fit <- cuminc(Surv(ttdeath, death_cr) ~ trt, trial)

model.matrix(fit) %>% head()

model.frame(fit) %>% head()
Broom methods for tidycrr objects
Description
Broom methods for tidycrr objects
Usage
## S3 method for class 'tidycrr'
tidy(x, exponentiate = FALSE, conf.int = FALSE, conf.level = x$conf.level, ...)

## S3 method for class 'tidycrr'
glance(x, ...)

## S3 method for class 'tidycrr'
augment(x, times = NULL, probs = NULL, newdata = NULL, ...)
Arguments
x |
a tidycrr object |
exponentiate |
Logical indicating whether or not to exponentiate the
coefficient estimates. Defaults to |
conf.int |
Logical indicating whether or not to include a confidence
interval in the tidied output. Defaults to |
conf.level |
Level of the confidence interval. Default matches that in
|
... |
not used |
times |
Numeric vector of times to obtain risk estimates at |
probs |
Numeric vector of quantiles to obtain estimates at |
newdata |
A |
Value
a tibble
See Also
Other crr() functions:
crr(),
predict.tidycrr()
Examples
crr <- crr(Surv(ttdeath, death_cr) ~ age + grade, trial)

tidy(crr)

glance(crr)

augment(crr, times = 12)
Broom methods for tidy cuminc objects
Description
Broom methods for tidy cuminc objects
Usage
## S3 method for class 'tidycuminc'
tidy(x, times = NULL, conf.int = TRUE, conf.level = x$conf.level, ...)

## S3 method for class 'tidycuminc'
glance(x, ...)
Arguments
x |
object of class 'tidycuminc' |
times |
Numeric vector of times to obtain risk estimates at |
conf.int |
Logical indicating whether or not to include a confidence
interval in the tidied output. Defaults to |
conf.level |
Level of the confidence interval. Default matches that in
|
... |
not used |
Value
a tibble
tidy() data frame
The returned tidy() data frame returns the following columns:
| Column Name | Description |
outcome | Competing Event Outcome |
time | Numeric follow-up time |
estimate | Risk estimate |
std.error | Standard Error |
n.risk | Number at risk at the specified time |
n.event | If the times= argument is missing, then the number of events that occurred at time t. Otherwise, it is the cumulative number of events that have occurred since the last time listed. |
n.censor | If the times= argument is missing, then the number of censored obs at time t. Otherwise, it is the cumulative number of censored obs that have occurred since the last time listed. |
cum.event | Cumulative number of events at specified time |
cum.censor | Cumulative number of censored observations at specified time |
If tidy(time=) is specified, then n.event and n.censor are the
cumulative number of events/censored in the interval. For example, if
tidy(time = c(0, 12, 18)) is passed, n.event and n.censor at time = 18
are the cumulative number of events/censored in the interval (12, 18].
p-values
The p-values reported in cuminc(), glance.tidycuminc() and add_p.tbl_cuminc()
are Gray's test as described in
Gray RJ (1988) A class of K-sample tests for comparing the cumulative incidence of a competing risk, Annals of Statistics, 16:1141-1154.
Confidence intervals
The confidence intervals for cumulative incidence estimates use the recommended method in Competing Risks: A Practical Perspective by Melania Pintilie.
x^{exp(±z * se / (x * log(x)))}
where x is the cumulative incidence estimate, se is the
standard error estimate, and z is the z-score associated with the
confidence level of the interval, e.g. z = 1.96 for a 95% CI.
See Also
Other cuminc() functions:
cuminc()
Examples
cuminc <- cuminc(Surv(ttdeath, death_cr) ~ trt, trial)

tidy(cuminc)

glance(cuminc)

# restructure glance to one line per outcome
glance(cuminc) %>%
  tidyr::pivot_longer(
    everything(),
    names_to = c(".value", "outcome_id"),
    names_pattern = "(.*)_(.*)"
  )
Competing Risks Regression
Description
Competing Risks Regression
Usage
## S3 method for class 'formula'
crr(formula, data, failcode = NULL, conf.level = 0.95, ...)

crr(x, ...)

## Default S3 method:
crr(x, ...)
Arguments
formula |
formula with |
data |
data frame |
failcode |
Indicates event of interest. If |
conf.level |
confidence level. Default is 0.95. |
... |
passed to methods |
x |
input object |
Value
tidycrr object
See Also
Other crr() functions:
broom_methods_crr,
predict.tidycrr()
Examples
crr(Surv(ttdeath, death_cr) ~ age + grade, trial)
Competing Risks Cumulative Incidence
Description
Competing Risks Cumulative Incidence
Usage
## S3 method for class 'formula'
cuminc(formula, data, strata, rho = 0, conf.level = 0.95, ...)

cuminc(x, ...)

## Default S3 method:
cuminc(x, ...)
Arguments
formula |
formula with |
data |
data frame |
strata |
stratification variable. Has no effect on estimates. Tests will be stratified on this variable. (all data in 1 stratum, if missing) |
rho |
Power of the weight function used in the tests. |
conf.level |
confidence level. Default is 0.95. |
... |
passed to methods |
x |
input object |
Value
tidycuminc object
Confidence intervals
The confidence intervals for cumulative incidence estimates use the recommended method in Competing Risks: A Practical Perspective by Melania Pintilie.
x^{exp(±z * se / (x * log(x)))}
where x is the cumulative incidence estimate, se is the
standard error estimate, and z is the z-score associated with the
confidence level of the interval, e.g. z = 1.96 for a 95% CI.
p-values
The p-values reported in cuminc(), glance.tidycuminc() and add_p.tbl_cuminc()
are Gray's test as described in
Gray RJ (1988) A class of K-sample tests for comparing the cumulative incidence of a competing risk, Annals of Statistics, 16:1141-1154.
See Also
Other cuminc() functions:
broom_methods_cuminc
Examples
# calculate risk for entire cohort -----------
cuminc(Surv(ttdeath, death_cr) ~ 1, trial)

# calculate risk by treatment group ----------
cuminc(Surv(ttdeath, death_cr) ~ trt, trial)
Deprecated
Description
DEPRECATED functions.
Usage
## S3 method for class 'tidycuminc'
autoplot(...)
Arguments
... |
not used |
Value
Misc.
Examples
# DO NOT USE DEPRECATED FUNCTIONS
gtsummary methods
Description
These functions are S3 methods for working with crr() model
results.
-
tbl_regression.tidycrr(): This function sets the tidycmprsk tidier forcrr()models. -
global_pvalue_fun.tidycrr(): This function ensures thatgtsummary::add_global_p(anova_fun)uses the Wald test by default (instead ofcar::Anova(), which does not support this model type). The Wald test is executed withcardx::ard_aod_wald_test(), which wrapsaod::wald.test().
Usage
## S3 method for class 'tidycrr'
tbl_regression(x, tidy_fun = tidycmprsk::tidy, ...)

## S3 method for class 'tidycrr'
global_pvalue_fun(x, type, ...)
Arguments
x |
( |
tidy_fun |
( |
... |
Additional arguments passed to |
type |
not used |
Value
gtsummary table or data frame of results
Examples
crr(Surv(ttdeath, death_cr) ~ age + grade, trial) |>
  gtsummary::tbl_regression() |>
  gtsummary::add_global_p() |>
  gtsummary::as_gt()
Estimate subdistribution functions for crr objects
Description
Estimate subdistribution functions for crr objects
Usage
## S3 method for class 'tidycrr'
predict(object, times = NULL, probs = NULL, newdata = NULL, ...)
Arguments
object |
a tidycrr object |
times |
Numeric vector of times to obtain risk estimates at |
probs |
Numeric vector of quantiles to obtain estimates at |
newdata |
A |
... |
not used |
Value
named list of prediction estimates
See Also
Other crr() functions:
broom_methods_crr,
crr()
Examples
crr(Surv(ttdeath, death_cr) ~ age, trial) %>%
  predict(times = 12, newdata = trial[1:10, ])
Print crr object
Description
Print crr object
Usage
## S3 method for class 'tidycrr'
print(x, ...)

## S3 method for class 'tidycuminc'
print(x, ...)
Arguments
x |
tidycrr object |
... |
not used |
Objects exported from other packages
Description
These objects are imported from other packages. Follow the links below to see their documentation.
- broom
- dplyr
- ggplot2
- gtsummary
add_n,add_nevent,add_p,global_pvalue_fun,inline_text,tbl_regression- survival
Tabular Summary of Cumulative Incidence
Description
Tabular Summary of Cumulative Incidence
Usage
## S3 method for class 'tidycuminc'
tbl_cuminc(
  x,
  times = NULL,
  outcomes = NULL,
  statistic = "{estimate}% ({conf.low}%, {conf.high}%)",
  label = NULL,
  label_header = "**Time {time}**",
  estimate_fun = NULL,
  conf.level = x$conf.level,
  missing = NULL,
  ...
)

tbl_cuminc(x, ...)
Arguments
x |
a 'tidycuminc' object created with |
times |
Numeric vector of times to obtain risk estimates at |
outcomes |
character vector of outcomes to include. Default is to include the first outcome. |
statistic |
string of statistic to report. Default is
|
label |
string indicating the variable label |
label_header |
string for the header labels; uses glue syntax.
Default is |
estimate_fun |
function that styles and formats the statistics.
Default is |
conf.level |
Level of the confidence interval. Default matches that in
|
missing |
string to replace missing values with. Default is an
em-dash, |
... |
not used |
Example Output
Example 1

Example 2
See Also
Other tbl_cuminc tools:
add_cuminc
Examples
# Example 1 ----------------------------------
tbl_cuminc_ex1 <-
cuminc(Surv(ttdeath, death_cr) ~ 1, trial) %>%
tbl_cuminc(times = c(12, 24), label_header = "**Month {time}**")
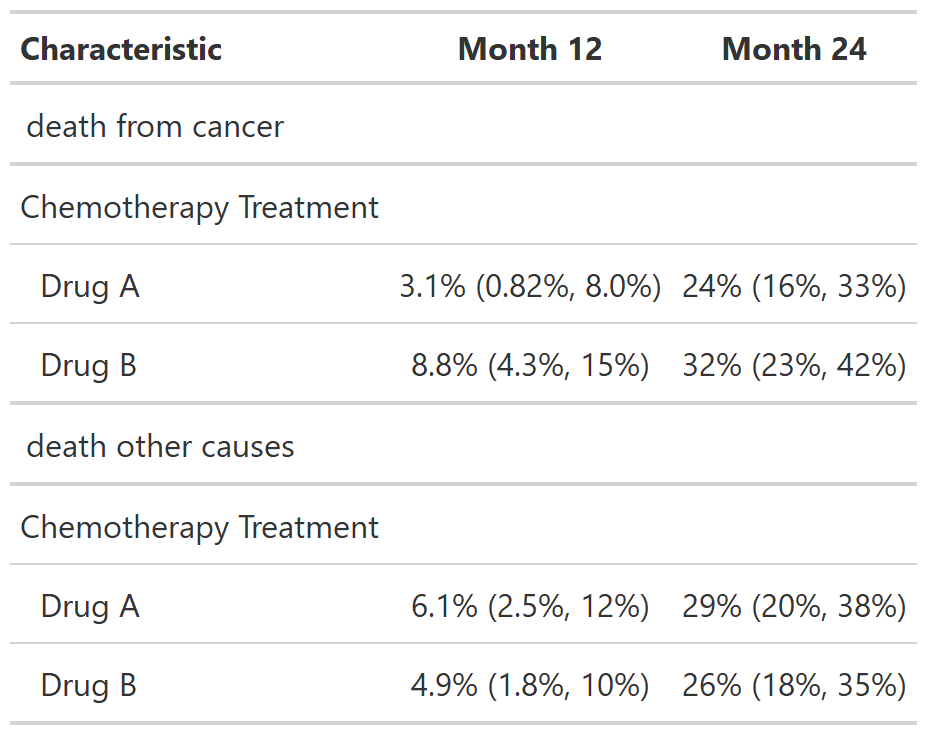
# Example 2 ----------------------------------
tbl_cuminc_ex2 <-
cuminc(Surv(ttdeath, death_cr) ~ trt, trial) %>%
tbl_cuminc(times = c(12, 24),
outcomes = c("death from cancer", "death other causes"),
label_header = "**Month {time}**")
Results from a simulated study of two chemotherapy agents
Description
A dataset containing the baseline characteristics of 200 patients who received Drug A or Drug B. Dataset also contains the outcome of tumor response to the treatment.
Usage
trial
Format
A data frame with 200 rows–one row per patient
- trt
Chemotherapy Treatment
- age
Age
- marker
Marker Level (ng/mL)
- stage
T Stage
- grade
Grade
- response
Tumor Response
- death
Patient Died
- death_cr
Death Status
- ttdeath
Months to Death/Censor